蓝屏死机(英语:Blue Screen of Death,缩写为:BSoD)指的是微软Windows操作系统在无法从一个系统错误中恢复过来时所显示的屏幕图像。Windows中有两个图像都被称为蓝屏死机,其中一个要比另一个严重得多。
蓝屏死机时会留下类似以下文字:
A problem has been detected and Windows has been shut down to prevent damageto your computer.PAGE_FAULT_IN_NONPAGED_AREA
If this is the first time you’ve seen this error screen,
restart your computer. If this screen appears again, follow
these steps:
Check to make sure any new hardware or software is properly installed.
If this is a new installation, ask your hardware or software manufacturer
for any Windows updates you might need.
If problems continue, disable or remove any newly installed hardware
or software. Disable BIOS memory options such as caching or shadowing.
If you need to use Safe Mode to remove or disable components, restart
your computer, press F8 to select Advanced Startup Options, and then
select Safe Mode.
Technical information:
*** STOP: 0×00000050 (0×00000000, 0×00000000, 0×00000000, 0×00000000)
Beginning dump of physical memory
蓝屏电脑自动重启的大致成因
微软对引起系统崩溃的原因进行的统计分析,结果如下图所示:

从图中我们可以知道,电脑崩溃自动蓝屏死机的绝大多数原因是第三方设备驱动程序导致的。有朋友会问电脑蓝屏怎么解决?如何修复?对于新手来说可以用《电脑蓝屏死机代码查询器》来查找大概就能知道原因。
如果不怕麻烦进行更细致的分析可以用下面的工具。
用Debugging Tools捉凶
步骤概略:1、打开”小内存转储”功能;2、配置WinDbg; 3、使用windbg分析Dump文件。
设置”小内存转储”功能
右键“计算机”–>属性–>高级系统设置–>高级–>启动和故障恢复,打开“启动和故障恢复”选项卡,在“写入调试信息”下拉列表中选中“小内存转储(xxxKB)”选项,取消”自动重新启动”的复选框,如下图:
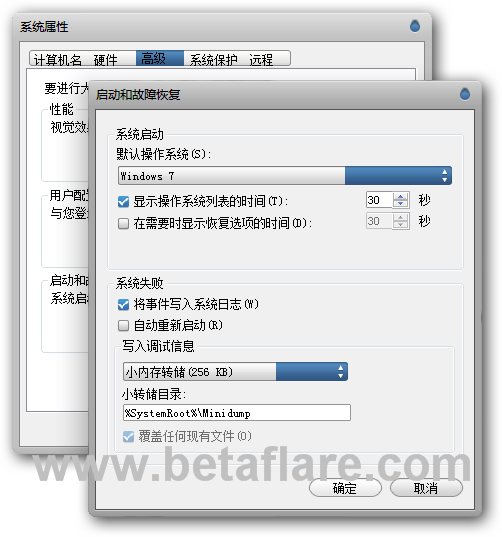
从图中可以看到dump文件的默认保存位置是在C:\WINDOWS\Minidump\
配置WinDbg
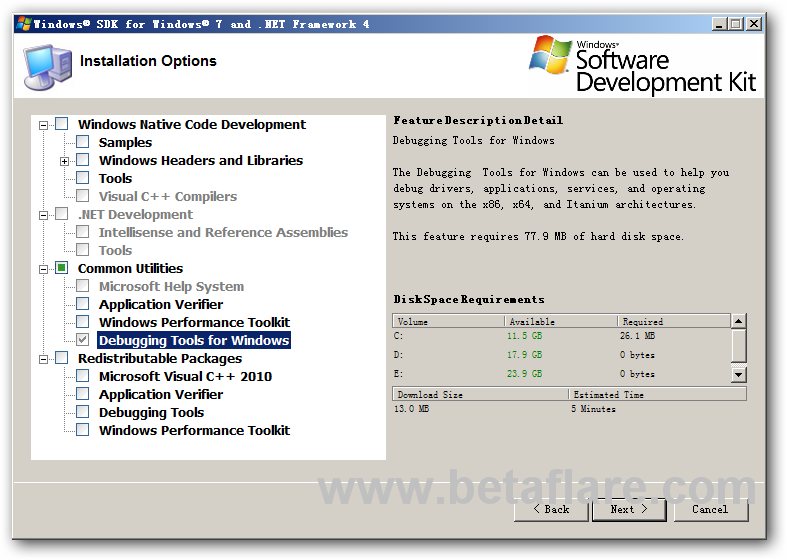
1、下载Debugging Tools 32位(Debugging Tools 64位)并安装,在如下图位置只勾选“Debugging Tools for windows”:
2、开始——>所有程序——>Debugging Tools for Windows,打开WinDbg。
3、配置Windows Debugging Tool
选一个临时目录存放Symbol文件。比如,建立一个目录叫C:\Temp
然后,打开WinDBG,在File菜单-〉选择Symbol File Path。在打开的对话框里输入:
SRV*c:\temp*http://msdl.microsoft.com/download/symbols
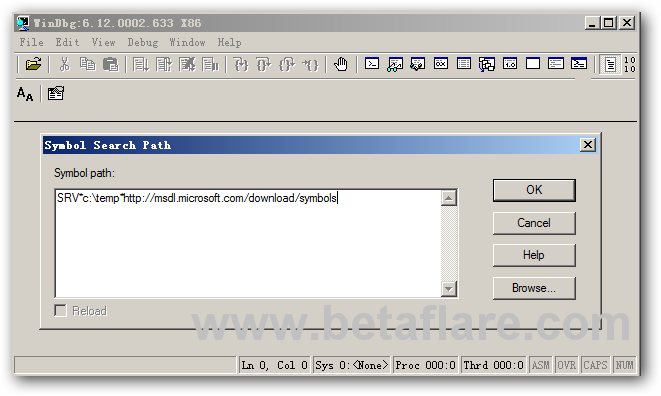
选择OK确定
然后 file –> save wordspace
这样WinDBG就配置好了。
注:要注意http://msdl.microsoft.com/download/symbols 是不可浏览的,仅适用于由调试器访问。
使用windbg分析Dump文件
点击程序窗口的“File ——> Open Crash Dump”,打开位于系统盘的minidump文件夹(例:C:\WINDOWS\Minidump\)下的以日期为文件名的.dmp文件。然后稍等片刻,等它加载符号文件。
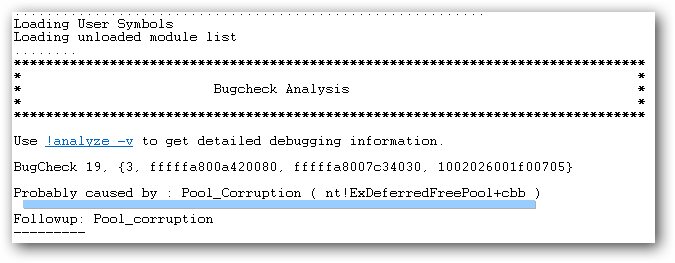
分析完后,如图中蓝屏线部分,找到“Probably caused by”这一行,其后面的文件就是导致蓝屏死机的程序。
另外可以看到Use !analyze -v to get detailed debugging information.字样和 kd> 提示符。
按照提示,输入或者单击”!analyze -v”命令。可以看到更详细的分析结果。